Organizational Chart
Organizational Chart block overview։
The Organizational Chart block is used to represent a hierarchical relationship between a group of items. The most common use case is mapping relationships between organization employees to present the whole organization hierarchy visually. So, let's see how the block is configured.
Linking to a data source
The data for the chart is fetched from a data source, so, first of all, we need to link the data source where our Organizational Chart data is located. This works the same way as for the Bar Chart. However, prior to connecting the data source, we need to have our data ready to be mapped to. In the next section, we'll show you how to set up the data with organization employees that can later be connected to our Org Chart block.
Setting up the data source
You can use Airtable or Google Sheets for the datasource - the setup is the same. For Google Sheets, ensure you have the first row setup as the column names. For linked fields, you’ll need to use the Softr-generated record ID to link records together. For more information using Linked Record fields in Google Sheets, please refer to the Google Sheets help document.
We’re going to demonstrate the process using Airtable data. Below, you can see the table we've set up for our chart. It's a simple list of organization employees with such fields as Email, Name, Position, Profpic, Department, Supervisor. The Supervisor field is a really important one, as it's used to establish the relationships between the employees. Therefore, let's examine it in greater detail.

Establishing relationships between employees
As mentioned above, the Supervisor (can be called anything) field is where you establish the hierarchical relationships between the chart nodes (organization employees in our case). It's a Parent relationship, so for each employee you need to select the person he/she reports to.
Below, you can observe the process of creating the Linked Record and selecting the Parent records.

Moreover, we've left Supervisor field empty for the company CEO (top node), as this record is not reporting to anybody and is going to be at the top of the chart.
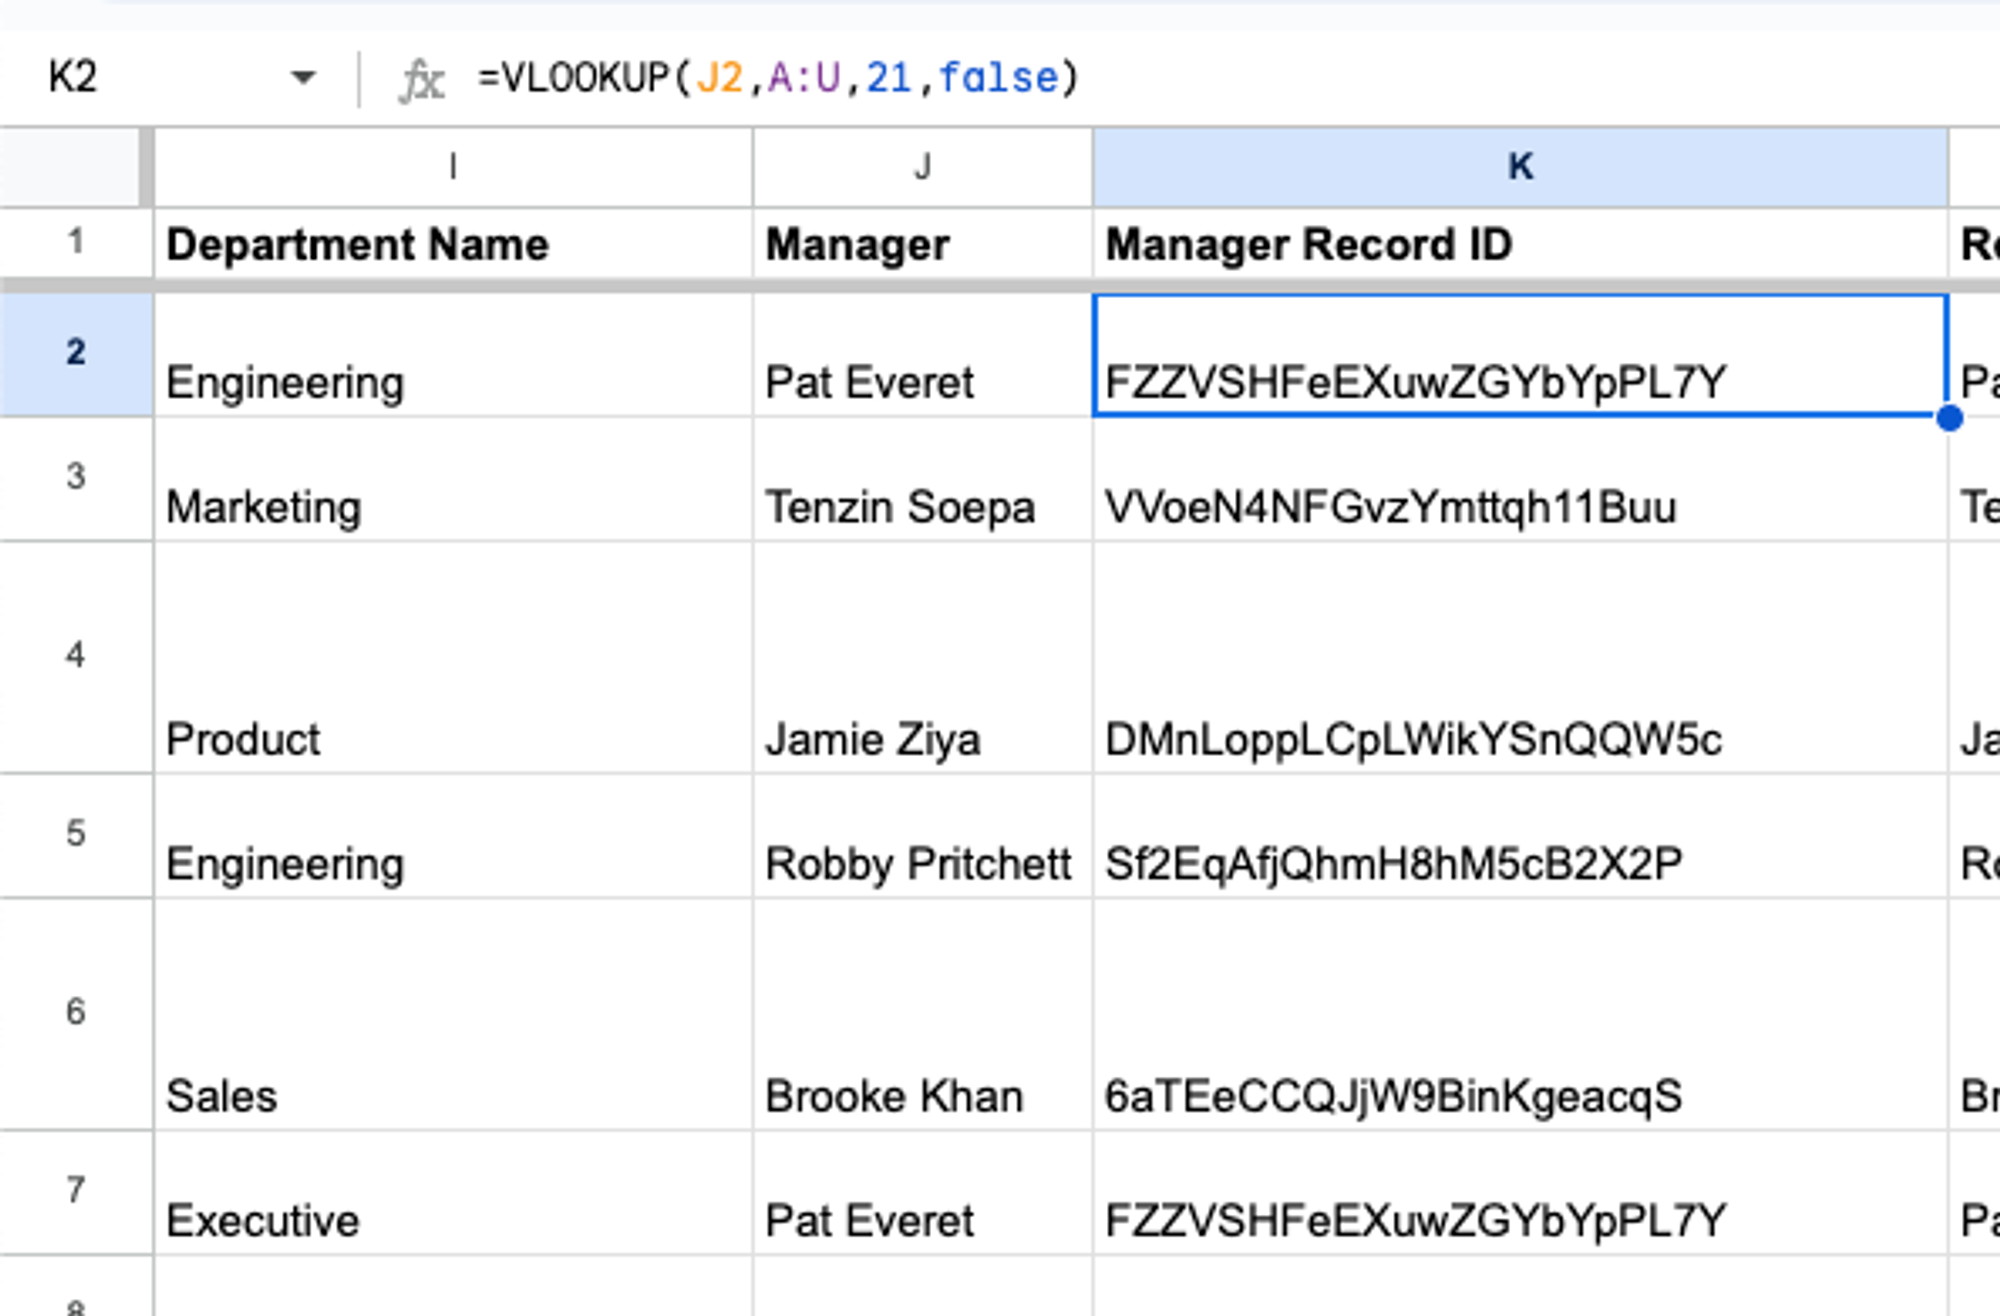
Now that our Airtable data is ready, let's proceed to mapping the fields from our chart block. If you’re using Google Sheets, you can use a VLOOKUP formula to pull in the Softr ID of an employee’s manager who is stored in the same sheet. This allows the Organizational chart in Softr to lookup the user record of the employees manager and show the heirarchy appropriately. Note that this is a computed field, and is determined by the name in the Manager column.

Mapping the chart fields
In the Features tab of block settings we first have the Title and Subtitle fields, which are used to add headings to the block.
Further on, there are 5 fields that we are going to map to the Airtable table we set up previously. Below you can see how that's done.

That's it. You can now publish your Softr app and present your team in a nice org chart layout.
Last updated on August 24, 2023